Today, I want to show how to calculate the Available Water Content (AWC) of soil using R. AWC refers to the quantity of water that the soil is capable of storing for use by plants. The capacity varies, depending on soil properties that affect retention of water. The most important properties are the content of organic matter, soil texture, bulk density, and soil structure, with corrections for salinity and rock fragments.
What is Available Water Content (AWC)?
The reason why I wanted to show the calculations of AWC using R is that there are very few online tools which have shown how to calculate AWC. AWC is actually one of the most important parameters in the calculation of the drought index scPDSI (self-calibrating Palmer Drought Severity Index). AWC is typically measured in millimeters of water available per meter of soil. This measure is crucial because it helps determine the water availability in different soil types under varying climatic conditions. For farmers, environmentalists, and scientists, AWC is a key parameter that influences decisions related to water management, crop planning, and even drought assessments.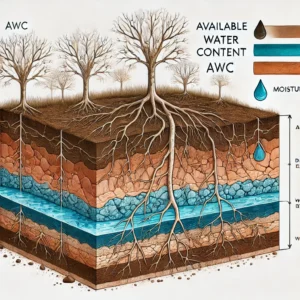
AWC Data
The AWC data was first developed by Webb et al. (2000) at the Oak Ridge National Laboratory. You can visit the site and download the actual data from here. The data contains global soil texture data as well as AWC data. You need to read the manual to understand and extract the data from here properly. However, we don’t need to do that manual work because already one scientist “cszang” has already done this work, visit his github.
Calculating AWC Using R
The process of calculating AWC can be a bit technical, especially if you’re doing it for the first time. We’ll use the R platform, specifically a library called awc, which is designed to facilitate this calculation. The installation of this library is not straightforward from CRAN, so you will need to install it directly from GitHub using devtools. The
awc package was developed by cszang, which makes our job very easy for calculating AWC.
- Go to the awc website in github and download the zip file named “awc-master.zip” to your local PC.
- open R studio, and install the package called
devtoolsusinginstall.packages("devtools"). - Now we use devtools to install
awcpackage to your R using the commanddevtools::install_local("path-to-your-awc-master.zip-file/awc-master.zip"). This will install awc package to your Rstudio.
Once you have successfully installed AWC library in your system, you can check it in R if it works or not.
get_awc(list(lon = 6, lat = 50.75))
It should give the output as [1] 195 mm.
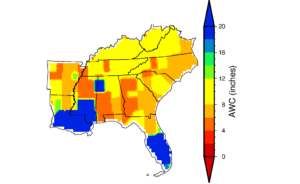
I have calculated the AWC map for the Southeast USA in one of my research papers. I am attaching the spatial colormap below that may give you some insights.
I hope you like the post. If you want to know how to extract the data from the raw files distributed by Webb et al. (2000) please let me know. Also, let me know your thoughts in the comments below.
References:
(1) Webb, R. W., C. E. Rosenzweig, and E. R. Levine. 2000. Global Soil Texture and Derived Water-Holding Capacities (Webb et al.). Data set. Available on-line [http://www.daac.ornl.gov] from Oak Ridge National Laboratory Distributed Active Archive Center, Oak Ridge, Tennessee, U.S.A. doi:10.3334/ORNLDAAC/548.