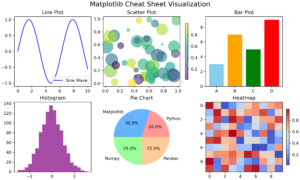
Welcome to the Matplotlib Cheat Sheet! This guide includes examples of basic and advanced plotting techniques to help you create stunning visualizations.
1. Import Matplotlib
import matplotlib.pyplot as plt2. Create a Basic Plot
x = [1, 2, 3, 4]
y = [10, 20, 25, 30]
plt.plot(x, y)
plt.title('Basic Plot')
plt.xlabel('X-axis')
plt.ylabel('Y-axis')
plt.show()
3. Customize Line Style and Markers
plt.plot(x, y, linestyle='--', marker='o', color='r')
plt.show()
4. Create a Figure and Subplots
fig, ax = plt.subplots(2, 2)  # 2x2 grid of subplots
ax[0, 0].plot(x, y)
ax[0, 0].set_title('Top Left')
plt.tight_layout()
plt.show()
5. Adjust Axes Properties
fig, ax = plt.subplots()
ax.plot(x, y)
ax.set_xlim(0, 5)
ax.set_ylim(0, 35)
ax.set_xticks([1, 2, 3, 4])
ax.set_yticks([10, 20, 30])
ax.set_xticklabels(['A', 'B', 'C', 'D'])
plt.show()
6. Add a Colorbar
import numpy as np
data = np.random.rand(10, 10)
plt.imshow(data, cmap='viridis')
plt.colorbar(label='Intensity')
plt.show()
7. Fancy Colorbar with Ticks
data = np.random.rand(10, 10)
cax = plt.imshow(data, cmap='coolwarm')
cbar = plt.colorbar(cax, ticks=[0, 0.5, 1])
cbar.ax.set_yticklabels(['Low', 'Medium', 'High'])
plt.show()
8. Box Plot
data = [7, 8, 5, 6, 9, 10, 15]
plt.boxplot(data)
plt.title('Box Plot')
plt.show()
9. Bar Plot
categories = ['A', 'B', 'C']
values = [10, 20, 15]
plt.bar(categories, values, color='skyblue')
plt.title('Bar Plot')
plt.show()
10. Horizontal Bar Plot
plt.barh(categories, values, color='lightgreen')
plt.title('Horizontal Bar Plot')
plt.show()
11. Line Plot with Multiple Lines
y2 = [15, 25, 20, 35]
plt.plot(x, y, label='Line 1')
plt.plot(x, y2, label='Line 2', linestyle='--')
plt.legend()
plt.show()
12. Scatter Plot
plt.scatter(x, y, color='red', label='Data Points')
plt.legend()
plt.show()
13. Shaded Region
plt.plot(x, y)
plt.fill_between(x, y, color='yellow', alpha=0.3)
plt.show()
14. Histogram
data = np.random.randn(1000)
plt.hist(data, bins=30, color='purple', alpha=0.7)
plt.title('Histogram')
plt.show()
15. Pie Chart
sizes = [15, 30, 45, 10]
labels = ['A', 'B', 'C', 'D']
plt.pie(sizes, labels=labels, autopct='%1.1f%%')
plt.title('Pie Chart')
plt.show()
16. Adding Grid
plt.plot(x, y)
plt.grid(color='gray', linestyle='--', linewidth=0.5)
plt.show()
17. Logarithmic Scale
plt.plot(x, y)
plt.yscale('log')
plt.title('Logarithmic Scale')
plt.show()
18. Annotate Points
plt.plot(x, y)
plt.annotate('Peak', xy=(3, 25), xytext=(2, 30),
             arrowprops=dict(facecolor='black', arrowstyle='->'))
plt.show()
19. Save Figure
plt.plot(x, y)
plt.savefig('plot.png', dpi=300, bbox_inches='tight')
20. Display Multiple Figures
plt.figure(1)
plt.plot(x, y)
plt.figure(2)
plt.plot(y, x)
plt.show()