Introduction
The concept of aridity and its quantification through the Aridity Index (AI) is crucial for understanding regional climatic conditions, especially in the context of global climate change. The Aridity Index, a simple yet powerful tool, provides insight into the dryness or wetness of regions, which is essential for effective water resource management, agricultural planning, and ecological conservation. In this blog, we delve into how the Aridity Index classifies different regions across the conterminous United States (CONUS) into varying levels of aridity, offering a clearer picture of our diverse climatic landscapes.
What is the Aridity Index?
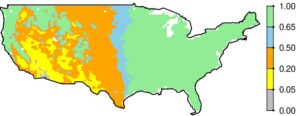
The Aridity Index (AI) is calculated as the ratio of long-term mean precipitation (P) to potential evapotranspiration (PET). This ratio, extensively studied and refined by Mukherjee et al. (2023), is based on the daily data from the National Climate Assessment – Land Data Assimilation System (NCA-LDAS) covering the period from 1979 to 2016. The AI is a robust measure that not only helps in assessing the hydrological and ecological characteristics of a region but also serves as a fundamental determinant in understanding how regions across CONUS adapt to their inherent moisture levels.
Classification of Regions Based on the Aridity Index
To simplify and make the data actionable, regions within CONUS have been categorized into five distinct aridity zones based on the Aridity Index:
- Hyper-Arid Regions (AI < 0.05): These regions are characterized by extremely low precipitation relative to potential evapotranspiration, leading to severe water scarcity. These areas often face significant challenges in sustaining agricultural activities and maintaining biodiversity.
- Arid Regions (0.05 ≤ AI < 0.20): With slightly more precipitation than hyper-arid zones, arid regions still experience high evaporative demand that often outstrips available moisture. This classification typically includes environments where water conservation and strategic resource management are critical to overcoming the impacts of water stress.
- Semi-Arid Regions (0.20 ≤ AI < 0.50): These areas exhibit fluctuations between dry and moderately moist conditions, making water management a challenging but crucial task. The variability in moisture availability can affect everything from agriculture to urban water supply.
- Sub-Humid Regions (0.50 ≤ AI < 0.65): Sub-humid zones are transitional areas that generally experience a balance between precipitation and evapotranspiration. Such regions are prone to occasional water stress but are typically capable of supporting a diverse array of plant and animal life.
- Humid Regions (AI ≥ 0.65): These regions are mostly free from aridity stress, with precipitation levels significantly exceeding the rates of potential evapotranspiration. While these areas are less likely to experience water scarcity, they may still face challenges related to excess moisture, such as flooding or waterlogging during peak rainfall periods.
The Aridity Index offers a nuanced view of the moisture dynamics across the United States, highlighting the diverse climatic conditions that can influence regional water resources, agricultural productivity, and ecological health. By classifying regions based on AI, policymakers, researchers, and environmental managers can better understand and anticipate the challenges associated with water scarcity and abundance.
References:
(1) Mukherjee, S., Mishra, A.K., Zscheischler, J. et al. Interaction between dry and hot extremes at a global scale using a cascade modeling framework. Nat Commun 14, 277 (2023). https://doi.org/10.1038/s41467-022-35748-7
doyantoto
Excellent beat ! I would like to apprentice while you amend your web site, how could i subscribe for a blog
web site? The account helped me a acceptable deal.
I had been a little bit acquainted of this your broadcast
offered bright clear concept
Thank you very much
sensa69 sensa69 sensa69 sensa69 (https://northernfortplayhouse.com/)
Your means of describing the whole thing in this piece of writing is genuinely
nice, all be capable of without difficulty be aware of
it, Thanks a lot.
Thank you very much sir
win88 win88 win88 win88
For hottest news you have to pay a quick
visit world wide web and on internet I found this
site as a best site for newest updates.
certainly like your website but you need to take a look at the spelling on quite a few of your posts. Many of them are rife with spelling problems and I find it very troublesome to inform the reality nevertheless I will definitely come back again.
kdg789 kdg789
kdg789 kdg789 kdg789
I visit each day some sites and information sites to read articles or reviews, however this blog gives feature based posts.
togelup togelup togelup
Please let me know if you’re looking for a article author for your weblog.
You have some really great articles and I believe I would be a good asset.
If you ever want to take some of the load off, I’d really like to
write some articles for your blog in exchange for
a link back to mine. Please shoot me an e-mail if interested.
Thank you!
Okay, let me know what is the exchange for.
toto12 toto12 toto12
It’s a shame you don’t have a donate button! I’d definitely donate
to this outstanding blog! I suppose for now i’ll settle for
book-marking and adding your RSS feed to my Google account.
I look forward to new updates and will share this website
with my Facebook group. Chat soon!
Thank you very much.
Tempat paling asik bermain slot game hanya di big77
Daftar Beberapa Harga Borak
cmbet88 cmbet88 cmbet88
Usually I do not read post on blogs, but I wish to say that this write-up very compelled me to
check out and do it! Your writing style has been amazed me.
Thank you, very great article.
Thank you very much
promo138 promo138 promo138
I visited various web pages but the audio feature
for audio songs present at this website is actually fabulous.
slot138 slot138 slot138
It’s in reality a nice and useful piece of information.
I’m happy that you just shared this helpful information with us.
Please keep us informed like this. Thank you for sharing.
bookmarked!!, I like your site!
What’s up mates, how is everything, and what you want to
say about this post, in my view its in fact remarkable in support of
me.
Howdy would you mind sharing which blog platform you’re using?
I’m planning to start my own blog in the near future but I’m having a tough
time choosing between BlogEngine/Wordpress/B2evolution and
Drupal. The reason I ask is because your design and style seems different
then most blogs and I’m looking for something completely unique.
P.S My apologies for being off-topic but I had to ask!
Hi there! I could have sworn I’ve been to this site before but
after browsing through some of the post I realized
it’s new to me. Anyhow, I’m definitely happy I found it and I’ll be book-marking and checking
back often!
Magnificent beat ! I would like to apprentice while you amend your web
site, how could i subscribe for a blog website? The account
aided me a acceptable deal. I had been a little bit acquainted of this your broadcast offered bright
clear concept
Your blog is a beacon of light in the often murky waters of online content. Your thoughtful analysis and insightful commentary never fail to leave a lasting impression. Keep up the amazing work!
I loved as much as youll receive carried out right here The sketch is tasteful your authored material stylish nonetheless you command get bought an nervousness over that you wish be delivering the following unwell unquestionably come more formerly again since exactly the same nearly a lot often inside case you shield this hike
I just wanted to express my gratitude for the valuable insights you provide through your blog. Your expertise shines through in every word, and I’m grateful for the opportunity to learn from you.